CenterPoint Logs 700% Surge in Data Center Grid Requests as U.S. Queue Hits 1,400 GW
- Analysis Data Centers Grid Capacity Grid Connection & Reliability
Marin Holt
- 0
- 7 minutes read
- CenterPoint Energy's data center interconnection queue grew 700% in one year, from 1 GW to 8 GW
- CEO Jason Wells called it a 'fundamental shift' driven by AI infrastructure development in Texas
- U.S. interconnection queue nationally holds 10,300 projects totaling 1,400 GW of generation and 890 GW of storage
- Average interconnection time grew from under two years in 2008 to nearly five years today
- CenterPoint forecasts Houston peak demand rising another 30% to 28+ GW by 2030
CenterPoint Energy reported a 700% increase in large-load interconnection requests between late 2023 and late 2024, with its queue expanding from 1 GW to 8 GW. Most of that growth is data centers. The pattern repeats across every major U.S. utility territory. Nationally, 10,300 projects representing 1,400 GW of generation and 890 GW of storage are actively seeking interconnection, and the average time to connect has grown from under two years in 2008 to nearly five years today, with some California projects exceeding nine years.
How the Backlog Formed
The problem has two distinct causes. First, transmission infrastructure stalled: U.S. transmission construction ran at roughly 1,700 miles per year from 2010 to 2014. Over the most recent two-year period, that figure dropped to 180 miles total. Grid capacity did not keep pace with the economy, let alone the AI-driven demand surge. Second, utility interconnection processes were not designed for simultaneous large-load applications. Planning tools built for neighborhood extensions cannot efficiently evaluate dozens of 100+ MW applications at once. Large loads like data centers receive inconsistent treatment across regions, unlike generation projects which follow a standardized federal process. The result is speculative applications flooding queues, legitimate projects waiting behind stale requests, and timelines that stretch beyond the planning horizon of any individual project.
Financial Consequences
The financial signal is the PJM capacity market. PJM’s annual capacity auction cleared at approximately $29 per megawatt-day for the 2024-2025 delivery year. For 2025-2026, it cleared at $270 per megawatt-day, roughly a 10x increase in a single year, driven directly by transmission constraints limiting the ability to move generation to load. Projects missing 2026-2028 start dates for clean energy tax credits face 30-50% cost increases. For a 5 MW data center, delayed interconnection defers roughly $5-12 million in first-year revenue. AI data center power demand is projected to reach 156 GW globally by 2030, up 3.5x from current levels. The revenue at stake for hyperscalers makes years-long interconnection delays financially intolerable, which is why on-site generation is moving from backup contingency to primary power strategy at many campuses.
What Data Centers Are Doing About It
Developers are combining limited grid access with on-site generation and storage to begin operations before full transmission infrastructure upgrades are complete. Gas turbines, fuel cells, and large battery systems handle base load while grid connection processes proceed in parallel. This approach compresses the effective delay from 5-7 years to 2-3 years in some regions. It also shifts the power reliability risk from the transmission system to the on-site plant, which for AI workloads is an acceptable trade-off given that on-site systems can be engineered to higher availability standards than shared grid infrastructure. The longer-term fix is transmission buildout and reformed interconnection processes, but those operate on decade-scale timelines. Data center operators plan around the system as it exists, not as it eventually will be.
Source: Camus Energy
Critical Analysis
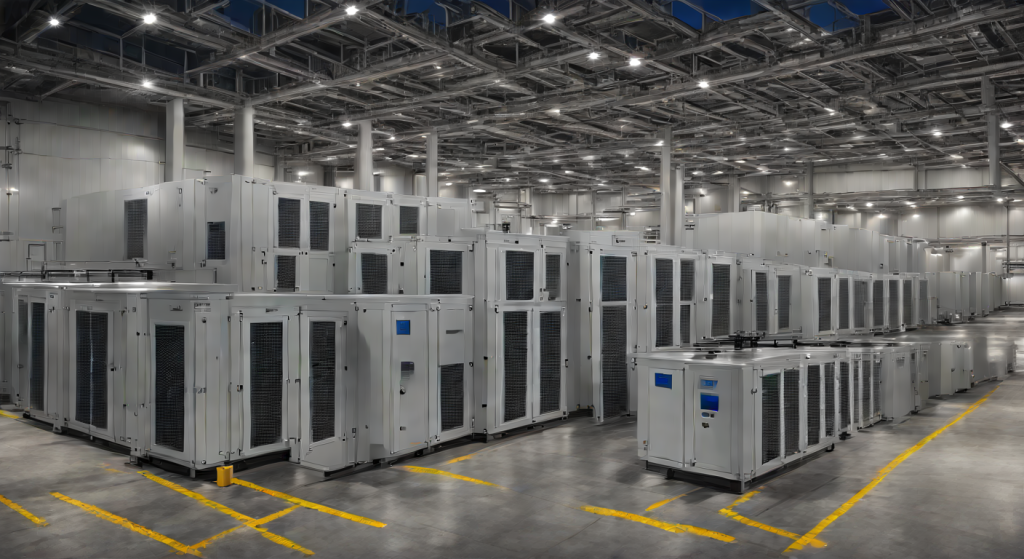
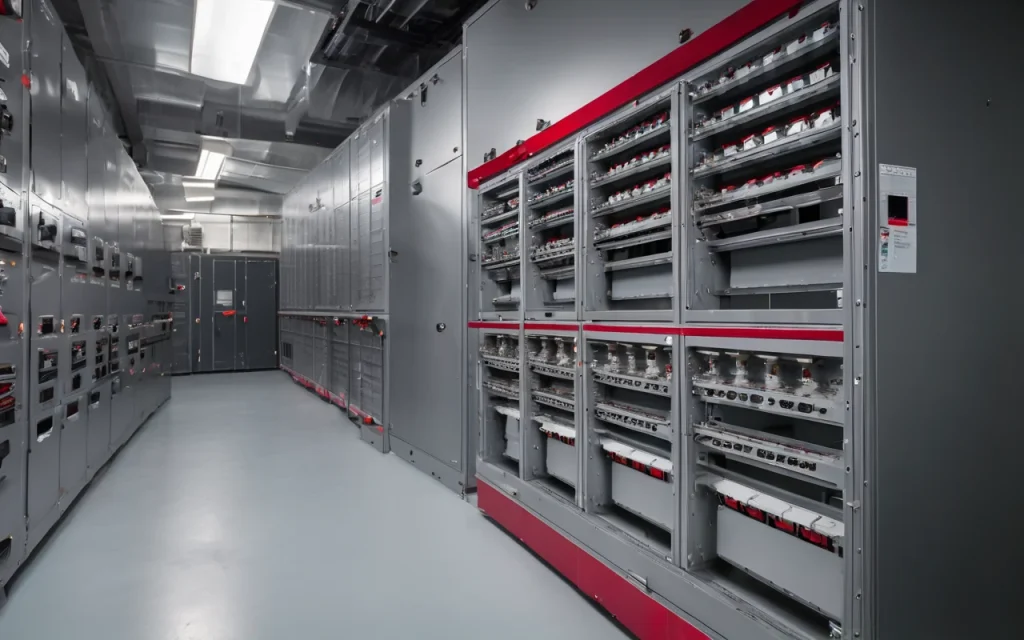
CenterPoint’s 8 GW data center queue represents concentrated nonlinear load: server UPS systems and rectifiers present THDi of 15-25% at 480 V switchgear, and a single 100 MW data center campus can inject TDD exceeding the IEEE 519-2022 Table 2 limit of 5% at the ISC/IL < 20 tier unless active harmonic filters are deployed at the PCC. CenterPoint's 8 GW queue equals 36% of its 22 GW system peak added incrementally with national transmission construction falling to 180 miles in the most recent two-year period.
5-Year Projection
The 5-year trajectory indicates severe supply chain bottlenecks for Grid Connection, pushing developers toward alternative topologies and domestic manufacturing pipelines.
Critical Perspective
CenterPoint’s queue grew by 7 GW in one year. This surge dwarfs the 1 GW of data center load added by Meta in its 2023 expansion. The 2003 California energy crisis saw similar interconnection backlogs and price spikes. Are we prepared for the transmission buildout required to support this demand?