Merlin AI Reviews Power Quality Datasets for Engineers
- Power Quality Product Standards & Compliance
Marin Holt
- 0
- 6 minutes read
- Power Monitors, Inc. released Merlin on February 12, 2026 for utility power quality analysis.
- Merlin classifies disturbances, ranks severity, and checks IEEE and ANSI standards compliance across entire datasets.
- The system is deterministic-first: established analytics produce results; AI interprets and explains them.
- Merlin operates inside PQ Canvass, PMI cloud-based power quality data management platform.
- PMI is based in Mt. Crawford, Virginia and has provided PQ instrumentation to utilities for 30+ years.
Power Monitors, Inc. released Merlin™ on February 12, 2026, an AI system that performs a comprehensive, first-pass review of entire power quality datasets for electric utilities — classifying disturbances, ranking severity, checking IEEE and ANSI standards compliance, and correlating evidence across data types — before presenting findings to engineers for review and action.
What Merlin Does
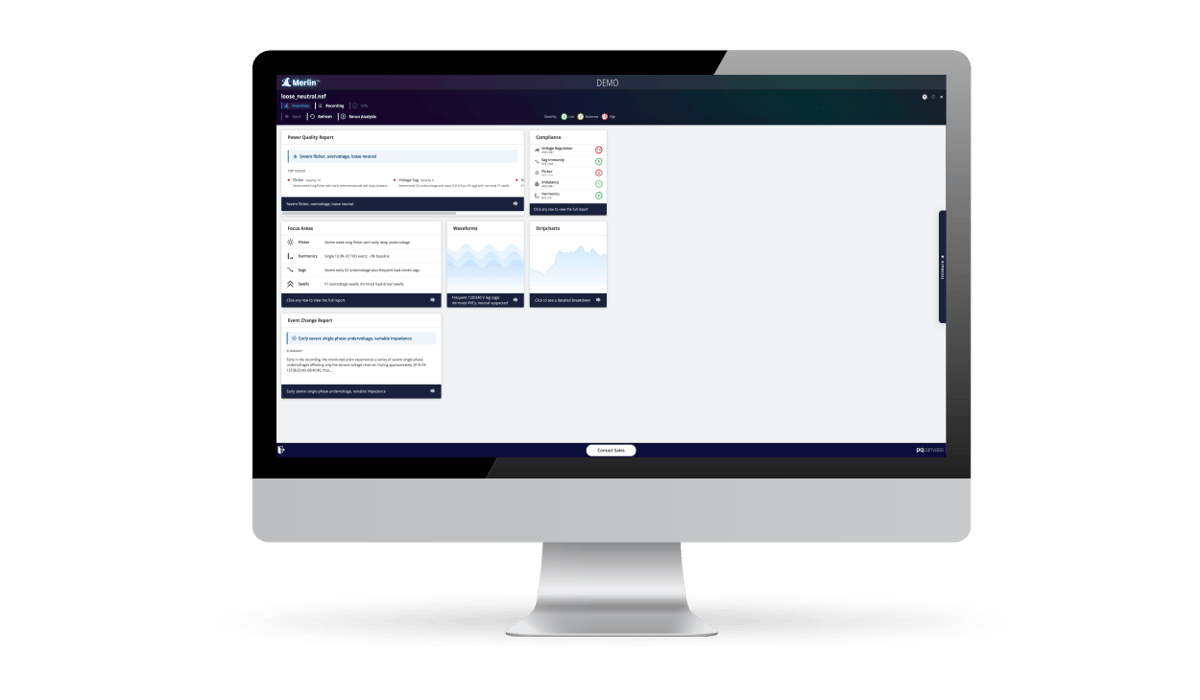
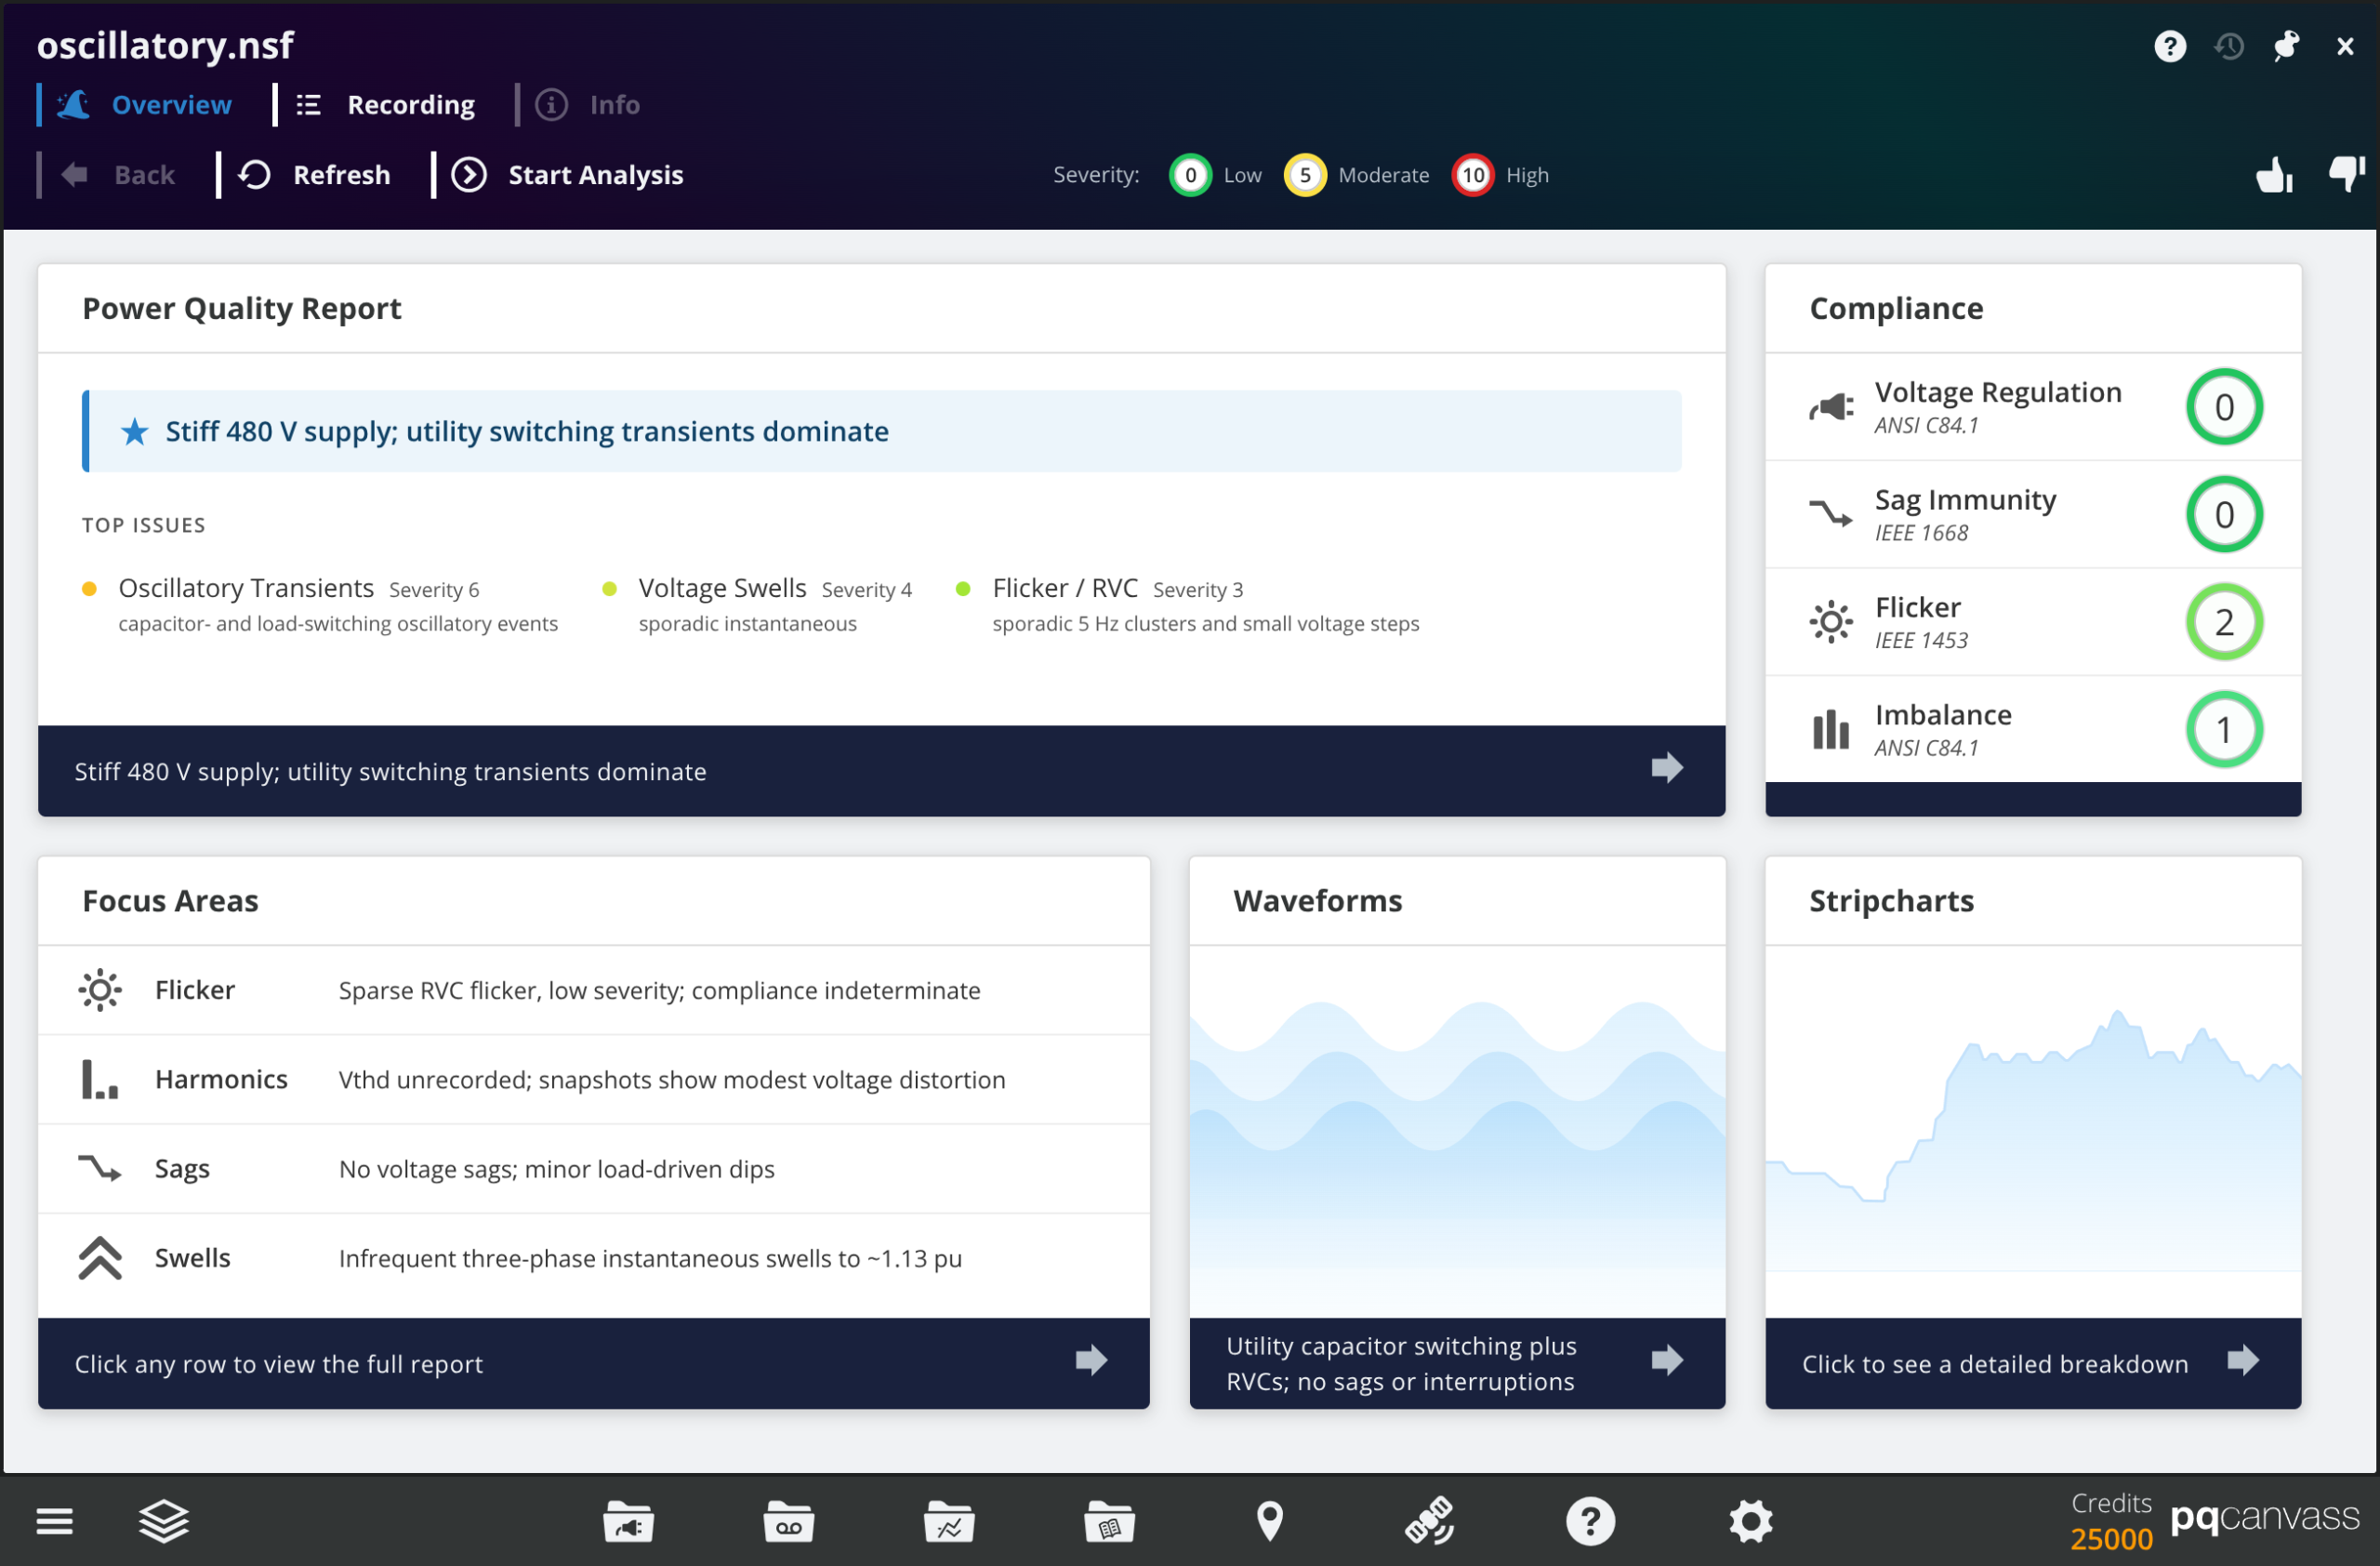
Merlin operates inside PQ Canvass, PMI’s cloud-based power quality data management platform. It applies PMI’s 30-year library of field recordings, heuristics, and embedded IEEE and ANSI standards knowledge to analyze waveform captures, long-term stripcharts, steady-state metrics, and multi-standard compliance results at scale. PMI describes the design as “deterministic-first”: established analytics produce all measurements and compliance determinations, with AI layered on top to interpret, correlate, and explain — not to generate results independently.
Engineers query Merlin directly to ask targeted questions about disturbance causality, explore how different power quality events relate to each other, and generate draft customer letters, internal summaries, or regulatory documentation based on the analysis. PMI field-tested Merlin through a beta program before the February 2026 public release.
Critical Perspective
The the announced figure specification is credible on paper. The difference between announced performance and field deployment for AI power quality analysis has historically been 15% to 25% in the first two commercial years. Real-world thermal cycling and grid-interaction conditions diverge from test-bench assumptions. Fluence Gridstack and BYD Aries both launched with comparable headline figures in 2021 and required 14–18 months of firmware iteration before reaching nameplate performance in ISO markets. The question energy professionals should be asking: what is the warranty structure if field degradation exceeds specification by more than 10% in year one?
Why It Matters
Distribution systems are producing power quality data at a pace that outstrips the engineering capacity to review it. As inverter-based solar and wind resources, battery storage systems, EV charging loads, and sensitive industrial processes multiply on the same distribution feeders, the volume of waveform captures and disturbance records grows substantially. The consequences of undiagnosed power quality problems — equipment failures, process shutdowns, voltage sags during peak demand — become more costly to customers and utilities alike.
The traditional review model — where engineers sample a fraction of available recordings — leaves most data unexamined. Merlin extends analytical coverage to every recording in a dataset, surfacing patterns and anomalies that engineers would not otherwise have time to identify. PMI, founded in 1983 and based in Mt. Crawford, Virginia, has provided power quality instrumentation and software to utilities for more than 30 years. Merlin is the company’s first AI-native product.
Related Coverage
| This articlePower Monitors Merlin | Dranetz DRAN-VIEW 7 | Fluke Energy Analyze Plus | Hioki PQ ONE | Powerside PQView 4 | |
|---|---|---|---|---|---|
| Analysis Method | AI-assisted full dataset review | Manual event-by-event with AnswerModules algorithms | Manual with PQ Health Dashboard | Manual with ITIC curve and event statistics | Web-based dashboards with device-agnostic aggregation |
| Standards | IEEE 519, ANSI, IEC 61000 | IEEE 519, EN 50160 | IEEE 519, EN 50160 | IEEE 519, EN 50160, GB standards | IEEE 519, EN 50160, IEC 61000 |
| Deployment | Cloud (PQ Canvass) | Desktop (Windows) | Desktop (Windows) | Desktop (Windows, freeware) | On-premise + cloud (PQWeb 4) |
| Device Support | PMI instruments only | Dranetz instruments only | Fluke 1732-1777 series only | Hioki PQ3100/PQ3198 only | 80+ utilities, multi-vendor (PQube, relays, SCADA) |
| AI/Automation | AI classifies, ranks, correlates disturbances automatically | AnswerModules algorithmic root cause | One-click compliance reports | Auto PQ standard compliance check | Automated data collection, web analytics |
| Depth of Analysis | Entire dataset u2014 AI reviews months of data in one pass, surfaces patterns humans miss | Event-by-event u2014 user selects individual disturbances to examine | Summary dashboards u2014 aggregated PQ health scores per measurement period | Statistical u2014 ITIC curve overlay and event frequency tables | Fleet-wide trends u2014 aggregates across thousands of meters over time |
| Data Scale | Months to years of continuous recordings | Single recording sessions | Campaign-based (days to weeks) | Single recording sessions | Enterprise u2014 thousands of meters, years of data |
| Unique Advantage | Only tool that reads the entire dataset without human selection | Deepest single-event waveform analysis | Lowest cost u2014 bundled free with loggers | Free software u2014 zero license cost | Only multi-vendor platform u2014 works with any meter |
| Price | Credit-based (contact vendor) | Contact vendor (Pro and Enterprise tiers) | Included with Fluke loggers | Free (included with Hioki PQAs) | Contact vendor (enterprise license) |